
This is a difficult topic to write about. The general population is somewhat squeamish on the subject. The topic of IQ can be explosive. As with anything, IQ can be controversial. The information is out there if people really have a desire to know and learn. My attempt here is geared more towards laying out the basics in order to obtain a general understanding of the subject.
An IQ score is a composite score of several tested areas comprised of reasoning, memory, acquired knowledge, and mental processing speed.
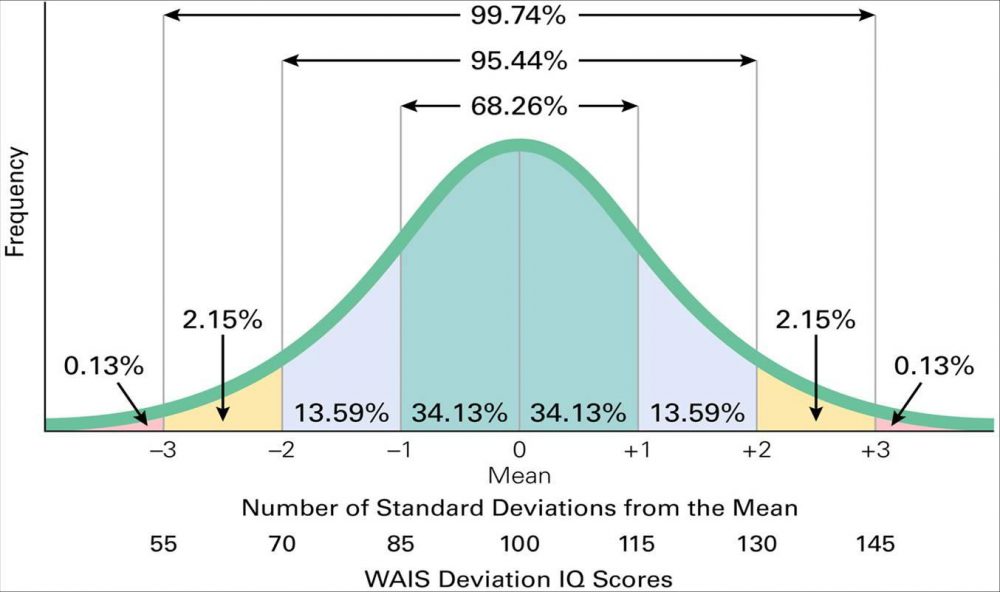
In the chart above, we can readily make several observations. The mean IQ score is 100. The standard deviations are by 15 point (SD=15) increments. Standard deviations can be both negative and positive. If a score falls below the mean of 100, it will be a negative SD. Above 100, a positive SD. Each SD above or below the mean is represented as SD- or SD+.
Referencing the chart again, we can see that roughly 68% of the general population will fall between SD-1 and SD+1. That correlates to an IQ value ranging from 85 to 115. And 95.44% are between 70 (SD-2) and 130 (SD+2). It should be noted that IQ tests are ‘recalibrated’ over time to obtain a 100 mean score. As the population gets ‘smarter’, the mean will adjust.
So, what does all of this mean? Without some sort of corresponding scale, IQ scores are hardly of any use. This is where we go to other sources to define the differences in IQ. The chart below breaks down IQ classifications.
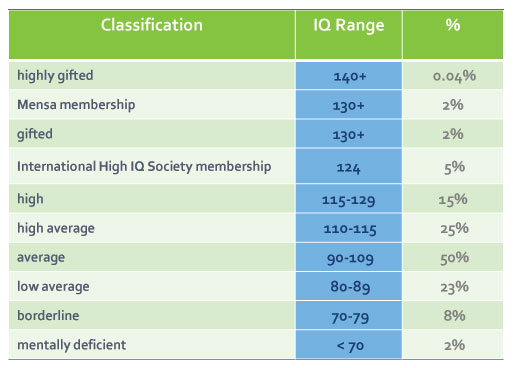
I refuse to comment much on the classification ranges. It’s a minefield to even try. I’ll let you come to your own conclusions. But I will say this much… less than 2% of the population fall into both the SD-2 and SD+2 ranges respectively. It has been suggested but never conclusively proven, that very high IQ people suffer from mental illnesses in greater frequencies than in normal intelligence ranges. True? God, I hope not… 😉